

CONTRIBUTORS

Francis Gannon
Co-Chief Investment Officer, Managing Director, Royce Investment Partners
Another positive quarter for most US equities
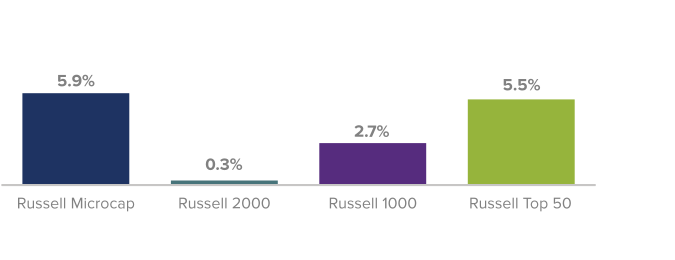
Although slowed by a volatile and bearish finish, small-cap stocks, as measured by the Russell 2000 Index, finished 2024 with a second consecutive positive quarter, gaining 0.3% in 4Q24. Unlike what happened in 3Q24, however, the small-cap index did not keep pace with its large-cap counterpart: the Russell 1000 Index was up 2.7% in 4Q24. Somewhat curiously, US equity returns had something like a bowl-shaped pattern in 2024’s final quarter. The Russell Microcap Index advanced 5.9% while the mega-cap Russell Top 50 Index rose 5.5%. Small-caps also hit a new peak on 11/25/24—more than three years after the previous peak on 11/8/21, which makes it the third longest span before a new peak was reached in the index’s more-than-45-year history.
The US Stock Market Bowl
Russell Index Returns, 9/30/24-12/31/24
Source: Russell Investments. Past performance is no guarantee of future results.
As was the case in 3Q24, positive performance in the year’s final quarter masked a certain amount of volatility as most stocks, regardless of market cap, staggered toward 2024’s finish line, making December an uneven month for the major domestic indexes that was substantially worse for the small- and micro-cap indexes.
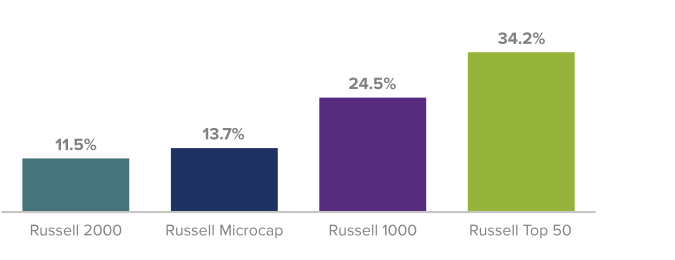
December’s underwhelming results notwithstanding, the upshot was a terrific year for small-cap performance on an absolute basis, with the Russell 2000 advancing 11.5%. Still, 2024 also marked an eighth straight year of underperformance relative to large-cap stocks. In fact, the Russell 2000 has beaten the Russell 1000 in only four of the last 20 calendar years, with an average outperformance spread 6.1%. It last did so in 2016, making the period ended 12/31/24 the longest underperformance stretch measured by calendar years since each index’s inception on 12/31/78. And while we are very aware of how long we have been looking forward to a sustained period of small-cap leadership, we do see promising signs for small-cap stocks on the horizon.
Another Big Year for Large-Cap Stocks
Russell Index Returns, 12/31/23-12/31/24
Source: Russell Investments. Past performance is no guarantee of future results.
A different world
The fourth quarter marked a pronounced divergence between US equities and their global cohorts. The MSCI ACWI ex-USA Small Cap and MSCI ACWI ex-USA Large-Cap Indexes were both down in 4Q24, losing -7.7% and -7.6%, respectively. With political unrest affecting Germany, France, and Canada, as well as China’s ongoing economic slump, this fourth-quarter downturn was not particularly surprising. To be sure, these results for the non-US indexes also show just how resilient both the US economy and markets have been in the post-Covid environment.
For the full year, both indexes were in the black, with the advantage accruing to large-cap. The MSCI ACWI ex-USA Small Cap gained 3.4% for 2024 while its large-cap counterpart was up 6.0%.
Inside US small-caps
As has often been the case historically when small-cap lags large-cap, the Russell 2000 Value Index trailed the Russell 2000 Growth Index in 4Q24, down -1.1% versus a 1.7% increase. December was generally harder on value stocks than on growth—reversing the usual historical performance pattern wherein small-cap value generally loses less in downturns, even short-term spans.
In terms of leadership, recent results remained mostly in small-cap growth’s favor, with the Russell 2000 Value trailing for the 1-, 5-, and 10-year periods ended 12/31/24. The Russell 2000 Value beat its growth sibling for the 3-year period ended 12/31/24 while also winning from the previous small-cap peak on 11/8/21 through the end of 2024, up 1.7% versus a loss of -7.1% for the Russell 2000 Growth, a result more in line with the small-cap value index’s long-term pattern of losing less—or even gaining, as in this instance—during downturns or more highly volatile markets.
The US small-cap sector story
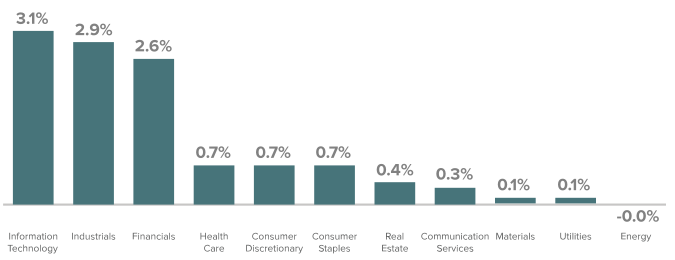
Five of the 11 sectors in the Russell 2000 were in the black for 4Q24, with information technology, industrials, and financials making the biggest positive contributions while health care, real estate, and energy detracted most.
At the industry level, two groups in information technology—software and semiconductors and semiconductor equipment—were among the three top contributing industries in 4Q24 while falling rates helped banks to make the second-biggest contribution in the quarter. Contributions in Industrials were spread a bit more widely, with aerospace and defense making the biggest positive impact. Biotechnology detracted most, while household durables, which is in consumer discretionary, energy equipment and services, and metals and mining from the materials sector, also had meaningful negative effects.
For the full year, 10 of 11 sectors contributed to performance, led by information technology, industrials, and financials. Energy was the lone detractor, and the smallest contributions came from utilities and materials. At the industry level, banks contributed most in 2024, followed by two groups in information technology: technology hardware, storage and peripherals and software. Construction and engineering, from industrials, also made a notable contribution. The industries that detracted most in 2024 were electrical equipment—which is in Industrials—health care technology, automobile components from consumer discretionary, and life sciences tools and services in health care.
10 of 11 Sectors Made Positive Contributions in 2024
2024 Sector Contributions in the Russell 2000
Source: Russell Investments. Past performance is not an indicator or a guarantee of future performance.
The stage is set—will US small-cap leadership follow?
One interesting consequence of the US equity market’s strength in 2024 was the relative dearth of volatility among large-cap stocks, as measured by the VIX. Often referred to as “the fear index,” the VIX is derived from the prices of SPX options with near-term expiration dates and generates a 30-day forward projection of volatility, a gauge of the speed with which share prices change. Except for a significant, though short-lived, spike in early August, large-cap stocks have enjoyed an uncommonly quiet year in 2024, just as they did in 2023.
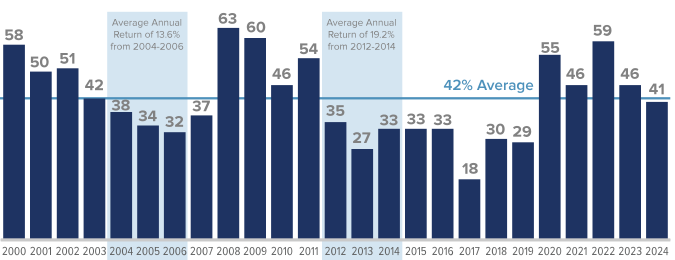
Within small-cap, the situation was somewhat different. In addition to monitoring the VIX, we look at the percentage of trading days with moves of 1% or more in the Russell 2000. The small-cap index’s average over the last 25 years has been 42% of days with such moves. In 2024, the Russell had 41%, or 103 out of 252 days with moves of 1% or more, making it an only marginally less volatile year for small-caps. Our more than five decades of small-cap investing tell us that this state of affairs will end regardless of asset class. We not only expect more historically typical levels of volatility for US stocks as a whole in 2025 but also think it’s important to remind our investors that we do not look at increased volatility through the conventional lens of fear but through the longer-range vista of opportunity. As risk-averse and price sensitive long-term investors, we always work to use short-term volatility to our long-term advantage.
In addition, history shows that periods of heightened volatility were followed by higher-than-average small-cap returns. We looked at subsequent average annualized returns for the Russell 2000 and the large-cap Russell 1000 following periods when the VIX was elevated, using monthly rolling return ranges for the volatility index. We found that the percentage of periods when the Russell 2000 had higher average annualized 3-year returns than the Russell 1000 were at their highest following periods of heightened volatility.
Small-Caps Generally Have Strong Three-Year Returns After Periods of High Volatility
Percentage of Trading Days with Moves of 1% or More in the Russell 2000 Over the Last 25 Years, 12/31/99-12/31/24
Source: Russell Investments. Past performance is no guarantee of future results.
Of course, context matters. It’s also important to remain mindful of how much more attractively valued small-caps are relative to large-caps. Based on our preferred index valuation metric of enterprise value over earnings before interest and taxes (EV/EBIT), the Russell 2000 finished 2024 near its lowest level versus the Russell 1000 in 25 years. Coupled with small-cap’s impressive absolute strength, especially through the second half of 2024, we are cautiously bullish as we enter 2025.
Definitions
The Russell 1000 Index is an unmanaged, capitalization-weighted index of domestic large-cap stocks. It measures the performance of the 1,000 largest publicly traded US companies in the Russell 3000 Index.
The Russell 2000 Index is an index of domestic small-cap stocks that measures the performance of the 2,000 smallest publicly traded US companies in the Russell 3000 Index.
The Russell 2000 Value and Growth indexes consist of the respective value and growth stocks within the Russell 2000 as determined by Russell Investments.
The Russell Microcap Index measures the performance of the microcap segment of the US equity market.
The Russell Top 50 Mega Cap Index is a market-capitalization-weighted index of the 50 largest stocks in the broad-based Russell 3000 universe of US-based equities.
The Standard & Poor’s® 500 Index (S&P 500®) is a market capitalization-weighted index of 500 stocks designed to measure total US equity market performance.
The MSCI ACWI ex USA Small Cap Index is an unmanaged, capitalization weighted index of global small-cap stocks, excluding the United States.
The MSCI ACWI ex USA Large Cap Index is an unmanaged, capitalization weighted index of global large-cap stocks, excluding the United States.
VIX is the ticker symbol and the popular name for the Chicago Board Options Exchange's CBOE Volatility Index, a popular measure of the stock market's expectation of volatility based on S&P 500 index options.
Enterprise value (EV) refers to the entire value of a company after taking into account both holders of debt and equity.
The EV/EBIT multiple is the ratio between enterprise value (EV) and earnings before interest and taxes (EBIT).
WHAT ARE THE RISKS?
All investments involve risks, including possible loss of principal. Past performance is no guarantee of future results. Please note that an investor cannot invest directly in an index. Unmanaged index returns do not reflect any fees, expenses or sales charges.
Equity securities are subject to price fluctuation and possible loss of principal.
Commodities and currencies contain heightened risk that include market, political, regulatory, and natural conditions and may not be suitable for all investors.
Small- and mid-cap stocks involve greater risks and volatility than large-cap stocks.
US Treasuries are direct debt obligations issued and backed by the “full faith and credit” of the US government. The US government guarantees the principal and interest payments on US Treasuries when the securities are held to maturity. Unlike US Treasuries, debt securities issued by the federal agencies and instrumentalities and related investments may or may not be backed by the full faith and credit of the US government. Even when the US government guarantees principal and interest payments on securities, this guarantee does not apply to losses resulting from declines in the market value of these securities.
Any companies and/or case studies referenced herein are used solely for illustrative purposes; any investment may or may not be currently held by any portfolio advised by Franklin Templeton. The information provided is not a recommendation or individual investment advice for any particular security, strategy, or investment product and is not an indication of the trading intent of any Franklin Templeton managed portfolio. Past performance does not guarantee future results.
Any data and figures quoted in this article sourced from Russell Investments, FactSet, Bloomberg and Reuters.
Important data provider notices and terms available at www.franklintempletondatasources.com. All data is subject to change.