

What's happening to active US small-cap management?
Contrary to some investors’ perception, active small-cap managers actually have a strong relative long-term performance record. Comparing Morningstar’s Small Blend category average (our proxy for active small-cap management) to the Russell 2000 Index over monthly rolling 5-year periods reveals that the Small Blend average beat the index 58% of the time. In our research into small-cap performance patterns, we uncovered a connection that we believe is significant. There seems to be a notable historical trend of active small-cap managers outperforming the Russell 2000 in periods when value stocks lead, while trailing the small-cap index when growth stocks lead. If this pattern holds, it carries a number of important implications for the current market, particularly if we are beginning an extended period of outperformance for value
Small blend funds often succeed when value leads
Our research first compared monthly rolling five-year returns for the “as published” Morningstar Small Blend category average to the Russell 2000, dating back to the index’s inception on 12/31/78. We then separated each rolling 5-year period into those in which the Russell 2000 Value Index led the small-cap market than those in which the Russell 2000 Growth Index led.
Small Blend Active Management Has Outperformed More in Value-Led Markets
Exhibit 1: Percentage Morningstar Small Blend Category Average Beat the Russell 2000 from 12/31/78 through 6/30/251
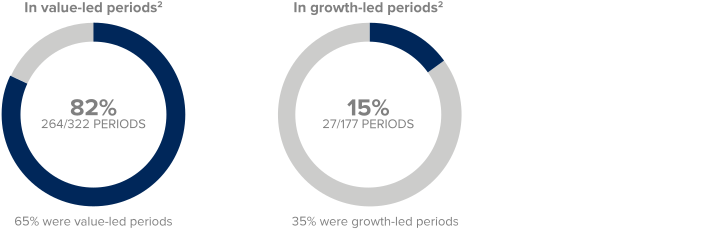
Source: Morningstar. The performance data and trends outlined in this presentation are presented for illustrative purposes only. Past performance is no guarantee of future results. Historical market trends are not necessarily indicative of future market movements. 1. There were 499 US Fund Small Blend Funds tracked by Morningstar with at least five years of performance history as of 6/30/25. 2. 5-Year Monthly Rolling Returns from 12/31/78 through 6/30/25 (499 periods).
The results were striking. Though the Morningstar Small Blend category average beat the Russell 2000 in 58% of all monthly rolling 5-year periods, it outperformed in 82% of value-led periods, but in only 15% of growth-led periods. And most periods— 65%—were value-led, which contributed to greater relative success for active management.
Scrutinizing our findings
These results were so compelling that we challenged them with four questions:
1. Is the Small Blend category an appropriate proxy for active small-cap management?
There are a number of limitations to using the Small Blend average. First, until recently1 it only covered mutual funds, a subset of all active managers; second, Small Value and Small Growth managers are also active managers; and third, while Small Blend funds may be intentional about their style positioning, it may also be a residual of where their managers see current opportunities. We chose to use Small Blend as an active management proxy primarily because it is relatively style neutral and therefore a more appropriate comparison to the Russell 2000. Moreover, we feel confident that most observers would expect Small Value managers to fare better versus the Russell 2000 in value-led periods. This beneficial relationship for Small Blend managers, however, was more unexpected.
2. How could this data show such strong results when so few active small-cap funds are currently outperforming the index?
The idea that very few funds are outperforming the index is somewhat exaggerated since 59% of Small Blend funds (main class only, 107 out of 180 funds) beat the Russell 2000 on a trailing 10-year basis ended 6/30/25.
3. Has this advantage been due to survivorship bias or funds moving from ‘Value’ to ‘Blend’?
No. According to Morningstar, the Small Blend category average is in effect a frozen snapshot. We calculated trailing 5-year returns from historical monthly category average return data that reflects all funds in existence that were classified as Small Blend in that month.
4. Has this relative performance connection been consistent over time?
The active spread of Small Blend versus the Russell 2000 for the trailing 5 years seems to have roughly tracked periods of value and growth leadership through history. This chart shows the active spread in green tracked along the spread between the Russell 2000 Value and the Russell 2000 in gray. Periods of leadership for growth are shaded—they were relatively rare until the most recent 16-plus-year period (2008-6/30/25).
Active Spread of Small Blend vs. the Russell 2000
Exhibit 2: Monthly Rolling Average Annual 5-Year Spread ended 6/30/25

Source: Russell Investments. As of month-end November 2022, Morningstar combined ETF's with open-end mutual funds in the Small Blend Category.
What explains this connection?
We wanted to know why value-led periods have tended to be more conducive to active outperformance than growth-led periods. Our view is that two distinct factors affect this outcome: equal-weighted portfolios vs. cap-weighted indexes and active managers’ training.
Equal weighted portfolios vs. Cap weighted indexes
First, most actively managed portfolios weight their holdings closer to equal weighted than capitalization weighted. This means that active managers are often challenged when trying to keep pace with their respective indexes in periods with narrow leadership—which are often dominated by a comparatively smaller number of stocks at the upper range of the index constituents.
Growth-led markets have historically demonstrated narrow leadership more often than value-led markets, which typically feature broader participation. 2019’s results offer an instructive example of this performance profile. The market-weighted Russell 2000 went up by 25.5% in 2019, and increased by 23.5% on an equal-weighted basis. During the same year, the Morningstar Small Blend category tied with the equal-weighted Russell 2000, returning 23.5%.
From this observation, we would venture that value-led markets are often characterized by a larger number of stocks advancing—and that this positive breadth helps create an advantage for active management.
In Sync: SC Value, Equal-Weighted, and Active Led
Exhibit 3: Five Years Ending 3/31/25 (%)
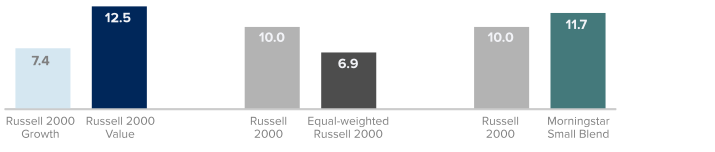
Source: Russell Investments. The Equal-Weighted Russell 2000 performance calculated by averaging monthly performance of all stocks in the Russell 2000.
Active managers' training
The classic training for portfolio managers and analysts contains a heavy dose of valuation work. Successful active management can be distilled to identifying situations where the intrinsic value of a company is appreciably higher than its current stock price, and this may be a second factor in Small Blend’s advantage in value-led markets. The ability to effectively use various valuation metrics is integral to this practice. As a result, active Small Blend managers will lean towards stocks with valuations selling for less than their intrinsic value and quite often less than their relevant benchmark.
Seen this way, most active Small Blend managers could be described, to some extent, as value managers. Their respective investment disciplines will make them hesitant to own, and certainly reluctant to hold at the top end of their portfolios, stocks whose valuations are meaningfully higher than their index. Yet these are precisely the companies that lead in growth-led markets. These high-valuation stocks are heavily weighted in the indexes, but are either not held, or are underweighted, by the majority of active managers.
What are the implications for investors?
With the usual caveats that past performance is no guarantee of future results, we have seen a historical trend in which active small-cap managers outperformed the Russell 2000 when value beat growth. So, the two correlations of active’s advantage when value led and growth’s when passive led are particularly relevant to investors if growth’s leadership is ending, even more so after a multi-year period when assets in passive small-cap products have significantly increased. As the 5-year annualized returns suggest, we believe such a change in leadership may have already started.
Russell 2000 5-Year Annualized Return Ranges
Exhibit 4: Monthly Rolling from 12/31/78 through 6/30/25

Source: Russell Investments. Past performance is no guarantee of future results.
Our research also found that certain market environments have seen more frequent periods of outperformance for value. The overall level of returns for small-caps is one factor that has coincided with the frequency of value’s outperformance. When the annualized 5-year return for the Russell 2000 was 5% or lower, the Russell 2000 Value outperformed in only 48% of the periods, though it averaged higher returns than the Russell 2000 Growth. And when annualized 5-year returns were in the 5-10% range, value beat growth 70% of the time, with a markedly wide spread. We think that’s particularly relevant now because Royce’s expectation for small-cap returns over the next five years is in this 5-10% range.
If subsequent annualized returns fall within this range, we believe that the odds favor small-cap value outperforming small-cap growth over the next five years. Consequently, we also think it is likely that this could be a period of outperformance for active management.
Making the case for US small-cap value leadership
Our view is that small-cap value stocks will lead small-cap growth stocks over the next several years based on how far recent relative performance and relative valuation has been from the history of the Russell small-cap indexes since inception (12/31/78). We believe that regression to the mean has historically been one of the more powerful and reliable forces with investing. Simply put, when the current behavior of an asset class is an outlier compared with its longer-term history, we think that the odds favor a reversal.
The seminal academic research on small-cap value outperformance, Fama-French’s 1992 Journal of Finance paper, noted that small-cap value stocks had outperformed small-cap growth stocks over the 27-year period from 1962-1989. Relative index performance and a frequency of 79%. Therefore, it is striking that the most recent experience has been so much of an outlier. As of June 30, 2025, small-cap value lagged small growth by -0.42%. Moreover, since 4/30/12, small-cap value trailed small-cap growth in 136 of 137 trailing 10-year periods. As the chart below shows, the magnitude and duration of small-cap value’s underperformance has only recently rebounded from a two standard deviation event that has not been matched over the last 25 years—even during the late 1990’s tech bubble.
Exhibit 5: Russell 2000 Value vs Growth Annualized Trailing 10-Year Relative Return as of 6/30/25
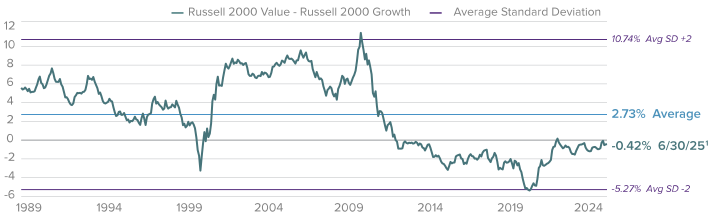
Source: Russell Investments. Standard Deviation is a measure that quantifies the amount of variation or dispersion in a data set. Roughly 68% of the data values are within one standard deviation of the mean. The 10-year average annual total return through 6/30/25 was 6.72% for the Russell 2000 Value and 7.14% for the Russell 2000 Growth. -0.42% represents the difference.
Russell 2000 Value and Growth Shifted Median Relative LTM EV/EBIT
Exhibit 6: Russell 2000 Value/Growth from 6/30/05 to 6/30/25
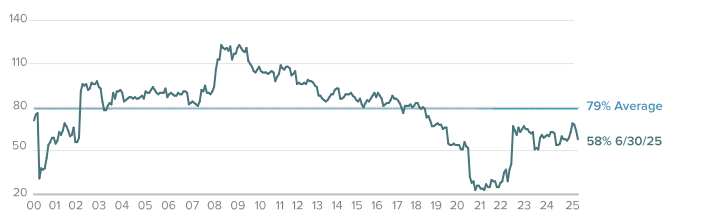
Source: FactSet. Last twelve months enterprise value/earnings before interest and taxes.
As one might expect, this relative underperformance of small-cap value stocks has contributed to an emerging valuation gap as well. When analyzing valuation, we use the ratio of EV to EBIT (enterprise value to earnings before interest and taxes) as we view this as a better valuation metric than price-to-earnings ratios for understanding an index’s valuation. Based on this EV/ EBIT measure, the common stocks that make up the small-cap value index currently sell at a 34% discount to those that make up the small-cap growth index, compared with a long-term average discount of 20%. By this measure small-cap value stocks have been selling at an attractive relative valuation in our view.
We hasten to add that as active managers we find some areas of small-cap value more attractive than others. Broadly, we see many cyclically sensitive stocks as undervalued. That said, the history of relative performance and relative valuation both signal to us the potential for a multi-year period of small-cap value outperformance.
Definitions
Small Blend Category: Small-blend portfolios favor US firms at the smaller end of the market-capitalization range. Some aim to own an array of value and growth stocks while others employ a discipline that leads to holdings with valuations and growth rates close to the small-cap averages. Stocks in the bottom 10% of the capitalization of the US equity market are defined as small-cap. The blend style is assigned to portfolios where neither growth nor value characteristics predominate.
The Russell 1000 Index is an unmanaged, capitalization-weighted index of domestic large-cap stocks. It measures the performance of the 1,000 largest publicly traded US companies in the Russell 3000 Index.
The Russell 2000 Index is an index of domestic small-cap stocks that measures the performance of the 2,000 smallest publicly traded US companies in the Russell 3000 Index.
The Russell 2000 Value and Growth indexes consist of the respective value and growth stocks within the Russell 2000 as determined by Russell Investments.
WHAT ARE THE RISKS?
All investments involve risks, including possible loss of principal. Past performance is no guarantee of future results. Please note that an investor cannot invest directly in an index. Unmanaged index returns do not reflect any fees, expenses or sales charges.
Equity securities are subject to price fluctuation and possible loss of principal.
Commodities and currencies contain heightened risk that include market, political, regulatory, and natural conditions and may not be suitable for all investors.
Small- and mid-cap stocks involve greater risks and volatility than large-cap stocks.
US Treasuries are direct debt obligations issued and backed by the “full faith and credit” of the US government. The US government guarantees the principal and interest payments on US Treasuries when the securities are held to maturity. Unlike US Treasuries, debt securities issued by the federal agencies and instrumentalities and related investments may or may not be backed by the full faith and credit of the US government. Even when the US government guarantees principal and interest payments on securities, this guarantee does not apply to losses resulting from declines in the market value of these securities.
Investments in fast-growing industries like the technology sector (which historically has been volatile) could result in increased price fluctuation, especially over the short term, due to the rapid pace of product change and development and changes in government regulation of companies emphasizing scientific or technological advancement or regulatory approval for new drugs and medical instruments.
Any companies and/or case studies referenced herein are used solely for illustrative purposes; any investment may or may not be currently held by any portfolio advised by Franklin Templeton. The information provided is not a recommendation or individual investment advice for any particular security, strategy, or investment product and is not an indication of the trading intent of any Franklin Templeton managed portfolio. Past performance does not guarantee future results.
Any data and figures quoted in this article sourced from Russell Investments, FactSet, Bloomberg and Reuters.
Important data provider notices and terms available at www.franklintempletondatasources.com. All data is subject to change.
WF: 6628720