

CONTRIBUTORS

Francis Gannon
Co-Chief Investment Officer, Managing Director, Royce Investment Partners
Markets seldom announce their turning points in a clear or obvious way. More often, they show up in subtle—and sometimes contradictory—ways.
One of the clearest recent examples could be seen at the end of March—the S&P 500 Index declined by -4.3% in 1Q26, while the average stock—as measured by the equal-weighted S&P 500—meaningfully outperformed. (Index returns are generally calculated on a capitalization-weighted basis.) This curious combination has only occurred a handful of times over the last five decades, including notable bear markets in the mid-1970s and early 2000s. A recent analysis by Furey Research Partners shows that, when this does happen, it tends to signal an inflection point in which weakness is concentrated at the top while the broader market begins to stabilize—or even strengthen.
Quarters in Which the S&P 500 Index Fell 4%+ and the S&P 500 Equal Weighted Index Outperformed by 4%+ (Since 1971)
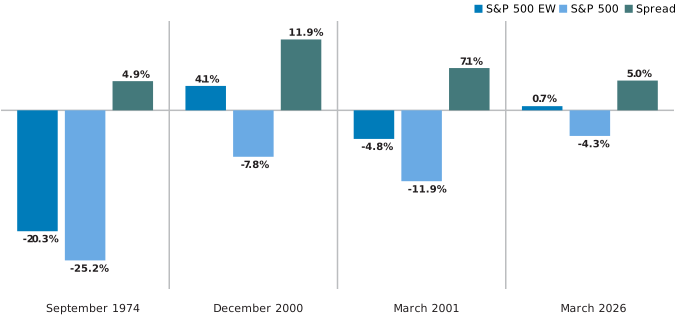
Source: Furey Research Partners. Past performance is no guarantee of future results.
For much of the last several years, returns have been driven by a narrow group of mega-cap companies. This kind of concentration typically pushes headline indexes higher (as has been the case over much of the last decade) while also sometimes obscuring what’s happening underneath. The initial stages of a shift toward broader participation are often marked by faltering leadership at the top coinciding with the average stock holding up better—which is precisely the dynamic we’ve been seeing.
It’s worth noting that these transitions are seldom smooth. As leadership changes hands, volatility often spikes as capital rotates across sectors, styles, and market capitalizations. While that can spur uncertainty at the index level, it also tends to foster a more fertile environment for active management—where security selection, rather than simple index exposure, can play a larger role in outcomes.
Historically, these periods have often coincided with inflection points in relative small-cap performance. In previous cycles—particularly in the mid-1970s and early 2000s—small-caps were coming off extended stretches of underperformance, trading at relatively depressed levels before embarking on a sustained period of leadership.
Today’s setup looks similar to us. Even after a healthy rebound off the April 2025 low for US stocks, small-caps remained below their long-term weight within the broader market. The Russell 2000 Index’s weight in the Russell 3000 Index, for example, stood at 4.6% at the end of March, well below its average historical average of 7.6%.1 Equally important, small-caps are still trading at much more attractive valuations compared to large-caps. By our index preferred valuation metric, EV/EBIT (enterprise value over earnings before interest & taxes), relative valuations are still near their lowest levels in more than 25 years.
We see especially noteworthy evidence that this shift may be underway in how small-caps have been behaving during recent periods of stress and/or volatility. In 1Q26, small-caps demonstrated remarkable resilience amid a highly volatile backdrop. The Russell 2000 Index posted a modest gain of 0.9% while large-caps declined meaningfully, highlighting a historically rare divergence.
To be sure, this result is so compelling based on how infrequently the pattern has occurred. As we noted recently, the large-cap Russell 1000 Index has experienced 26 down quarters over the last 25 years—and the Russell 2000 has beaten it only eight times, including 1Q26.2 In addition, small-caps had a positive return in only one other previous down quarter for large-cap, which occurred during the Great Financial Crisis.
Leadership within small-cap has remained intact, with the smallest companies—that is, micro-caps—continuing to lead and extending a multi-quarter trend of outperformance that began off the April 2025 market lows. Indeed, the Russell Microcap Index gained 84.1% from 4/8/25-4/30/26.
At the same time, the underlying pattern of performance continues to point toward expanding breadth. The average stock—as measured by the equal-weighted S&P 500—has held up better than the cap-weighted index during recent periods of higher-than-average volatility. Even more important from our small-cap-centric perspective, many small-cap companies are emerging from a multi-year earnings slowdown with expectations for stronger growth ahead—potentially providing a fundamental tailwind to complement improving sentiment.
Periods where dispersion increases alongside improving breadth have historically led to a wider range of outcomes between winners and losers. For active managers focused on fundamentals, this widening dispersal often presents a more compelling opportunity set, particularly in small-cap where business models, balance sheets, and earnings trajectories tend to vary more widely.
So, while the shift in market leadership away from narrow, mega-cap-driven results to broader participation has been creating more volatility, it has also historically expanded the opportunity set for active investors like us. We believe small-caps appear particularly well positioned given the combination of more attractive relative valuations, improving earnings prospects, and historically low expectations.
None of this guarantees a sustained change in leadership. But history suggests that when markets transition from concentration to participation—especially from depressed relative levels—the opportunity set tends to widen. For investors willing to look beyond the largest names—and to navigate the volatility that often accompanies these shifts—the environment may be becoming increasingly favorable.
Stay tuned...
Endnotes
- Source: FTSE Russell, Russell 2000 Index factsheet. As of April 30, 2026.
- Source: FTSE Russell, Russell US Indexes. As of March 2026.
Definitions
The S&P 500 Index is an unmanaged index of 500 stocks that is generally representative of the performance of larger companies in the United States.
The Russell 1000 Index is an unmanaged, capitalization-weighted index of domestic large-cap stocks. It measures the performance of the 1,000 largest publicly traded US companies in the Russell 3000 Index.
The Russell 2000 Index is an index of domestic small-cap stocks that measures the performance of the 2,000 smallest publicly traded US companies in the Russell 3000 Index.
The Russell Microcap Index measures the performance of the microcap segment of the US equity market. Microcap stocks make up less than 3% of the US equity market (by market cap) and consist of the smallest 1,000 securities in the small-cap Russell 2000® Index, plus the next smallest eligible securities by market cap.
Enterprise value (EV) refers to the entire value of a company after taking into account both holders of debt and equity.
The EV/EBIT multiple is the ratio between enterprise value (EV) and earnings before interest and taxes (EBIT).
WHAT ARE THE RISKS?
All investments involve risks, including possible loss of principal. Past performance is no guarantee of future results. Please note that an investor cannot invest directly in an index. Unmanaged index returns do not reflect any fees, expenses or sales charges.
Active management does not ensure gains or protect against market declines.
Equity securities are subject to price fluctuation and possible loss of principal.
Commodities and currencies contain heightened risk that include market, political, regulatory, and natural conditions and may not be suitable for all investors.
Small- and mid-cap stocks involve greater risks and volatility than large-cap stocks.
US Treasuries are direct debt obligations issued and backed by the “full faith and credit” of the US government. The US government guarantees the principal and interest payments on US Treasuries when the securities are held to maturity. Unlike US Treasuries, debt securities issued by the federal agencies and instrumentalities and related investments may or may not be backed by the full faith and credit of the US government. Even when the US government guarantees principal and interest payments on securities, this guarantee does not apply to losses resulting from declines in the market value of these securities.
Any companies and/or case studies referenced herein are used solely for illustrative purposes; any investment may or may not be currently held by any portfolio advised by Franklin Templeton. The information provided is not a recommendation or individual investment advice for any particular security, strategy, or investment product and is not an indication of the trading intent of any Franklin Templeton managed portfolio. Past performance does not guarantee future results.
Any data and figures quoted in this article (unless stated) are sourced from FTSE Russell, FactSet, Bloomberg and Reuters.
Important data provider notices and terms available at www.franklintempletondatasources.com. All data is subject to change.
WF: 10388510