

CONTRIBUTORS

Francis Gannon
Co-Chief Investment Officer, Managing Director, Royce Investment Partners
Small- and Micro-Cap Stay at the Head of the Class in the Second Quarter
In the bullish second quarter of 2026, small- and micro-cap stocks continued to lead the US equity markets in a robust period for equities of all sizes and styles. Resilience amid mixed signals was once again the main theme, as geopolitical tensions remained unresolved, inflation lingers, and energy prices are still volatile, depending on the changing state of the war with Iran on any given day. On the plus side, the economy was still in solid shape. Consumers were spending, even as they reported lower confidence in economic growth, while the AI buildout continued to gain momentum (though not without controversies of its own, most notably around the enormous amount of energy needed to power data centers).
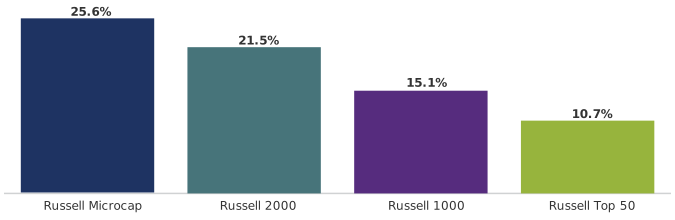
Against this backdrop, US, stocks roared back from the low or negative returns in 1Q26. For the second quarter, the Russell 2000 Index rose 21.5%, and the Russell Microcap Index gained 25.6%, versus respective gains of 15.1% and 10.7% for the large-cap Russell 1000 Index and mega-cap Russell Top 50 Index. (The tech-heavy Nasdaq Composite was up 21.6% for the same period.)
In a Bullish Quarter, Small- and Micro-Cap Remained in Front
2Q26 Russell Index Performance
Source: Russell Investments. Past performance is no guarantee of future results.
Small- and micro-cap leadership also encompassed longer-term periods. For the year-to-date period ended 6/30/26, the Russell 2000 advanced 22.6%, while the Russell Microcap increased 27.5% compared to a gain of 10.3% for the Russell 1000 and 2.0% for the Russell Top 50. For the one-year period ended 6/30/26, the Russell 2000 was up 40.8%, the Russell Microcap gained 58.5%, the Russell 1000 was up 22.0%, and the Russell Top 50 returned 16.3%.
Very Impressive Small-and Micro-Cap Performance off the 2025 Low
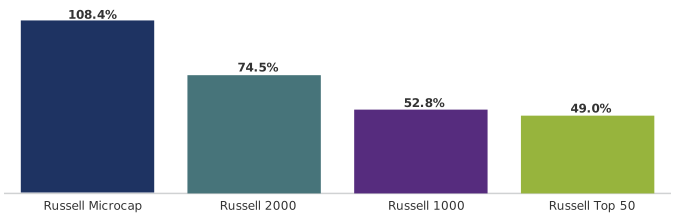
Performances off the last market bottom were even more impressive: From 4/8/25 through 6/30/26, the Russell 2000 was up 74.5%—while the Russell Microcap advanced 108.4%. Over this same period, the Russell 1000 and Russell Top 50 rose 52.8% and 49.0%, respectively—and the Nasdaq was up 73.1%.
Small- and Micro-Cap Stocks Were Impressive off the 2025 Market Low
Russell Index Performance, 4/8/25-6/30/26
Source: Russell Investments. Past performance is no guarantee of future results.
Foreign Affairs
Results for non-US stocks decoupled from the pattern of their stateside peers in 2Q26, with non-US small-caps trailing non-US large-caps. The MSCI ACWI ex-USA Small Cap Index advanced 9.6% in 2Q26 while the MSCI ACWI ex-USA Large Cap Index was up 15.7%.
Year-to-date and one-year results followed the same pattern, with non-US small-caps underperforming their large-cap counterparts. For the year-to-date period ended 6/30/26, the MSCI ACWI ex-USA Small Cap gained 9.1%, and the MSCI ACWI ex-USA Large Cap was up 14.4%. For the one-year period ended 6/30/26, the non-US small-cap index rose 19.8%, while its large-cap sibling gained 29.3%.
Inside Small-Cap: Growth Leads for the Quarter, Value for Most Other Periods
After beating its growth counterpart for three straight quarters, small-cap value trailed in the second quarter, with the Russell 2000 Value Index gaining 17.2% versus 25.7% for the Russell 2000 Growth Index, buoyed in large part by greater exposure to all things AI.
Small-cap value had the advantage over several other, longer-term periods. The Russell 2000 Value beat the Russell 2000 Growth for the year-to-date (+23.0 versus +22.2%), one-year (+43.0% vs. +38.7%), three-year (+18.7% vs. +18.4%), and five-year (+8.2% vs. +5.6%) periods ended 6/30/26, while small-cap growth had the advantage off the 4/8/25 low, gaining 77.1% vs. 71.8% through 6/30/26, as well as for the 10-year period ended 6/30/26, up 12.0% vs. 10.9%.
The Small-Cap Sector Story: Tech Rules in 2Q26, While Industrials, Health Care, and Financials Were Also Strong
Ten of the 11 sectors in the Russell 2000 made positive contributions to 2Q26 results. Information technology had the biggest impact by far, followed by Industrials, health care, and financials. Energy was the only sector that detracted from performance in the quarter.
At the industry level, three areas of tech were particularly strong—semiconductors & semiconductor equipment, software (which rebounded significantly after a dismal 1Q26), and electronic equipment, instruments & components. Outside of tech, electrical equipment (from industrials), biotechnology (health care), and banks (financials) all made notable contributions. Detractions were comparably muted in the quarter; within the energy sector, oil, gas and consumable fuels had the biggest negative effect due to the war and consequent impact on global energy supplies.
All 11 sectors in the Russell 2000 Index finished the six-month period ended 6/30/26 in the black, with information technology again making the biggest positive impact. Industrials followed fairly closely, while financials and health care also contributed meaningfully. The smallest contributions came from utilities, consumer staples, and communication services, which were also the lowest weights in the Russell 2000 Index at the end of June. The top-contributing industries were semiconductors & semiconductor equipment, electrical equipment, banks, and another area within tech, electronic equipment, instruments and components.
Are Earnings Driving Small-Cap Returns?
We have been arguing for the last couple of years that small-cap leadership was likely to be accompanied by improved earnings growth. With many small-caps mired in a nearly two-year earnings recession coming into 2025, we were cautiously optimistic that a mean reversion would occur. Of course, every mean reversion needs a catalyst, and throughout 2025 we noted a few potential sources, the most compelling in our view being the gradually improving earnings picture for many small-cap stocks, especially those involved in AI. During 2025, we observed that the AI buildout—which up until roughly the first few months of 2025 had mostly benefited mega-cap companies such as Alphabet, Apple, Microsoft, and Nvidia—was beginning to filter through to those small- and micro-cap companies that were selling into the AI supply chain.
We own several companies that have been reaping the benefits of the trillions of dollars being spent on AI because they provide differentiated products or services that are key enablers of AI’s evolution and the buildout of its infrastructure. These companies are supplying the tools, components, and services to their mega-cap cousins, covering everything from the semiconductor components that enable various AI applications, the energy providers critical to data center operations, and the construction companies that are building them or preparing the sites. These are the companies that are driving small- and micro-cap performance so far this year.
Wanting to get a clearer picture of how earnings have been driving small-cap results, we looked at both the year-to-date and one-year periods ended 6/30/26 for the Russell 2000 Index to gauge how much of its respective advances were attributable to earnings growth. We broke the returns down into three components—earnings per share (EPS) growth, dividends, and price-earnings (P/E) ratio expansion (or contraction). Our research showed that more than 60% of each period’s return came from EPS growth.
The Road Ahead: Reasonable Small-Cap Valuations, Strong Earnings, and Higher Volatility
Although small-cap’s market leadership is scarcely 15 months old, some commentators have already begun to question whether or not the asset class can maintain leadership in the months ahead. The reasons being offered are unconvincing, at least from our admittedly small-cap-centric perspective, and have mostly been rooted in the unlikelihood of recent sky-high returns for both small- and micro-cap stocks being sustainable, along with the possibility of interest-rate increases. First, we think it’s worth remembering that few if any market pundits were making similar arguments about large- and/or mega-cap stock prices returning to earth until their leadership was more than a decade old. Second, that leadership stretch was one of the longest for large-cap stocks in the nearly 80 years since the end of World War II. Finally, our research has found that the sensitivity of small-cap performance to rate hikes (or cuts) is not as closely correlated as many assume; it also tends to discount (if not ignore) the performance of small-cap companies with little or no debt.
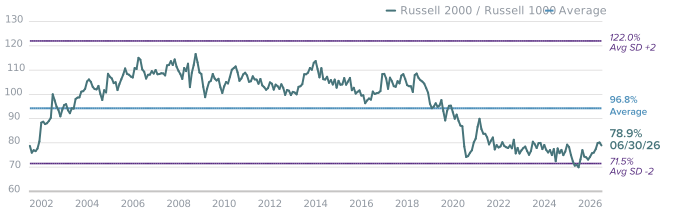
Most important from our standpoint is that the combination of small-cap valuations and earnings should be more than sufficient to keep the asset class in the leadership role. As we always do, we looked at the data, which in this case means our preferred index valuation measure, EV/EBIT, or enterprise value over earnings before interest & taxes. The chart below shows that valuations for small-cap versus large-cap, even after more than a year of robust returns, were still close to their lowest levels versus the Russell 1000 in 25 years at the end of June.
Relative Valuations for Small-Caps vs. Large-Caps Remain Near Their Lowest in 25 Years
Russell 2000 vs. Russell 1000 Median LTM EV/EBIT (ex. Negative EBIT Companies), 6/30/01 through 6/30/26
Source: FactSet.
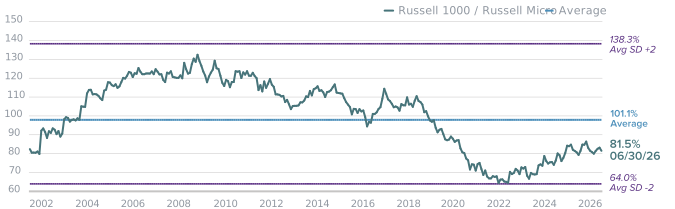
Of course, micro-caps have performed even better than small-caps over the last year. So we applied the same EV/EBIT metric to look at how valuations for the Russell Microcap compared to the Russell 1000. While the gap is not as wide, valuations for the Russell Microcap finished June still below their long-term average compared to the Russell 1000.
Relative Valuations for Micro-Caps vs. Large-Caps Remain Below Their Long-Term Average Over the Last 25 Years
Russell Microcap vs. Russell 1000 Median LTM EV/EBIT (ex. Negative EBIT Companies), 6/30/01-6/30/26
Source: FactSet.
Relatively attractive valuations are seldom enough to keep an asset class in a leadership position on their own. Earnings growth ultimately drives long-term returns—and in that regard the news has stayed positive, with earnings fundamentals continuing to improve for many small- and micro-cap companies. To be sure, consensus estimates are pointing to faster earnings growth ahead (as they have for the last several months).
Small-Cap’s Estimated Earnings Growth Is Expected to Remain Higher Than Large-Cap’s in 2026 and 2027
One-Year EPS Growth
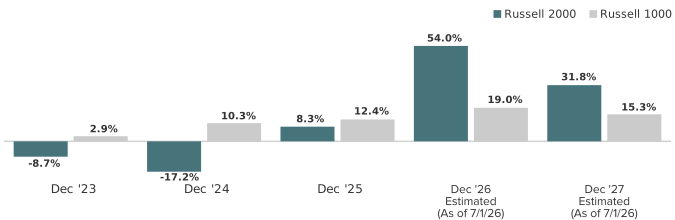
Source: FactSet. Earnings per share (EPS) is calculated as a company’s profit divided by the outstanding shares of its common stock. The EPS Growth Estimates are the pre-calculated mean two-year EPS growth rate estimates by brokerage analysts. Estimates are the average of those provided by analysts working for brokerage firms who provide research coverage on each individual security as reported by FactSet. All non-equity securities, investment companies, and companies without brokerage analyst coverage are excluded. Past performance is not guarantee of future results.
Equally important, most of our investment teams own holding that have been doing well, while also finding what they think are excellent long-term opportunities in the wide and diverse selection universe of small- and micro-cap stocks. To this point, we think it’s important to note that, while much is made of the fact that more than 40% of the companies in the Russell 2000 have no earnings, the small- and micro-cap universe still has more profitable companies than the Russell 1000 or S&P 500 Indexes. This combination of relatively more attractive valuations and ongoing earnings strength bolsters our conviction that the current environment continues to offer many compelling opportunities for active, fundamentals-driven investors with a long-term horizon.
Can Higher Volatility = More Opportunities?
The ride may not always be smooth in the months ahead because upswings are often interrupted, though not waylaid, by periods of higher volatility as investors assess and re-assess their choices. One method we use to gauge volatility is to track the number of days in which the small-cap index moves up or down 1% or more. By this volatility measure, we believe the performance of small-cap tech offers a compelling example of how volatility is a factor in positive market moments.
Information technology was the standout sector in both 2Q26 and the first half of 2026—and it was more volatile than the overall Russell 2000 during both periods. In 2Q26, there were 20 out of 62 days, or 32%, when the Russell 2000 had such moves, while information technology had 47 such days, or 76% (most of which were up days). In the first half of 2026, there were 50 out of 123 days for the Russell 2000, or 41%, while information technology had 86 days when the sector moved up or down 1% or more, or 70%.
We do not see this as a danger sign or a prelude to a correction. We have always seen volatility as an ally—a common market force that allows disciplined investors with a long-term horizon to take advantage of short-term movements in order to potentially enhance market-beating results over the long run.
Definitions
The Russell 1000 Index is an unmanaged, capitalization-weighted index of domestic large-cap stocks. It measures the performance of the 1,000 largest publicly traded US companies in the Russell 3000 Index.
The Russell 2000 Index is an index of domestic small-cap stocks that measures the performance of the 2,000 smallest publicly traded US companies in the Russell 3000 Index.
The Russell Top 50 Index is a market-capitalization-weighted index of the 50 largest stocks in the broad-based Russell 3000 universe of US-based equities.
The Russell Microcap Index measures the performance of the microcap segment of the US equity market. Microcap stocks make up less than 3% of the US equity market (by market cap) and consist of the smallest 1,000 securities in the small-cap Russell 2000® Index, plus the next smallest eligible securities by market cap.
The Russell 2000 Value and Growth indexes consist of the respective value and growth stocks within the Russell 2000 as determined by Russell Investments.
The MSCI ACWI ex USA Small Cap Index is an unmanaged, capitalization weighted index of global small-cap stocks, excluding the United States.
The MSCI ACWI ex USA Large Cap Index is an unmanaged, capitalization weighted index of global large-cap stocks, excluding the United States.
The S&P 500 Index is an unmanaged index of 500 stocks that is generally representative of the performance of larger companies in the United States.
Enterprise value (EV) refers to the entire value of a company after taking into account both holders of debt and equity.
The EV/EBIT multiple is the ratio between enterprise value (EV) and earnings before interest and taxes (EBIT).
WHAT ARE THE RISKS?
All investments involve risks, including possible loss of principal. Past performance is no guarantee of future results. Please note that an investor cannot invest directly in an index. Unmanaged index returns do not reflect any fees, expenses or sales charges.
Active management does not ensure gains or protect against market declines.
Equity securities are subject to price fluctuation and possible loss of principal.
Commodities and currencies contain heightened risk that include market, political, regulatory, and natural conditions and may not be suitable for all investors.
Small- and mid-cap stocks involve greater risks and volatility than large-cap stocks.
US Treasuries are direct debt obligations issued and backed by the “full faith and credit” of the US government. The US government guarantees the principal and interest payments on US Treasuries when the securities are held to maturity. Unlike US Treasuries, debt securities issued by the federal agencies and instrumentalities and related investments may or may not be backed by the full faith and credit of the US government. Even when the US government guarantees principal and interest payments on securities, this guarantee does not apply to losses resulting from declines in the market value of these securities.
Any companies and/or case studies referenced herein are used solely for illustrative purposes; any investment may or may not be currently held by any portfolio advised by Franklin Templeton. The information provided is not a recommendation or individual investment advice for any particular security, strategy, or investment product and is not an indication of the trading intent of any Franklin Templeton managed portfolio. Past performance does not guarantee future results.
Any data and figures quoted in this article (unless stated) are sourced from FTSE Russell, FactSet, Bloomberg and Reuters.
Important data provider notices and terms available at www.franklintempletondatasources.com. All data is subject to change.
WF: 11440508