

CONTRIBUTORS

Christopher Jensen
Head of Research,
Franklin Templeton Digital Assets

David Alderman
Research Analyst,
Franklin Templeton Digital Assets
This article was first published on July 5, 2023 by CoinDesk.
When evaluating layer 1 (L1) blockchains, many fundamental investors focus on metrics such as Price-to-Earnings and Price-to-Sales. While these metrics are important, they ignore the programmable aspect of a blockchain’s token supply. Because a blockchain’s emissions schedule (i.e. when new tokens will enter circulation due to staking rewards and token unlocks) is known, its cost structure into the future is essentially known too.
Years-to-Profitability (YTP) is a useful new metric for analyzing layer 1 blockchain profitability as it incorporates the blockchain’s forward supply curve. It applies the TradFi concepts of break-even analysis and payback periods to crypto. The analysis views an L1 blockchain through the lens of a business that sells secured blockspace. Revenues are the fees that users pay to record transactions on the chain and expenses are the costs needed to secure the network. YTP calculates a blockchain’s profitability timeline by factoring in the protocol’s current revenue and cost structure, a projected growth rate (CAGR), and future supply dynamics.
We find YTP compelling because it provides a comprehensive framework for evaluating an individual blockchain or comparing multiple blockchains.
We start our calculation with Token Terminal’s definition of L1 profitability:1
Transaction Fees
(–) Supply Side Fees
_______________________________________________________________________________
Revenue (Burned Fees)
(–) Token Incentives (Unlocks, Staking Rewards, etc)
__________________________________________________________________________
Net Profit
It is important to note that all revenues and costs are in the L1’s native token. And, while unlocks and staking rewards both increase the number of tokens in circulation, the difference between transaction fees and the portion of those fees paid to proof-of-stake validators is what is used to burn or reduce the number of tokens in circulation. In this sense, YTP measures the point at which an L1’s circulating supply stabilizes at 0% inflation. Some broad assumptions we make are (i) the percentage of the transaction fee burned remains constant, (ii) the foundation takes 10 years to sell all its tokens, and (iii) for revenues, we start with the L1’s last quarter’s revenues annualized (LQA).
In comparing YTP across blockchains, it’s helpful to group the L1s by whether they have an inflationary tokenomic model or a max supply model, because with the latter, an L1 might “break even” simply because the chain’s fixed supply was reached (as modeled for SUI or ADA).
Years to Profitability
(Assuming Various Revenue Growth CAGRs)
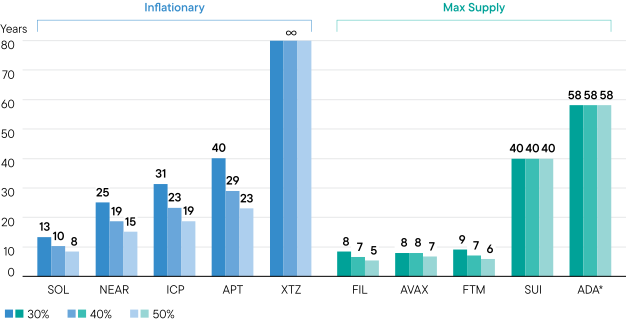
Sources: The Tie, Token Terminal, Artemis, Franklin Templeton Estimates Two notable L1 exclusions from our analysis are Ethereum and Binance Smart Chain because they are already profitable.
*On the Cardano blockchain, 20% of ADA fees are paid to the Cardano Foundation. Note, the foundation uses these funds to grow and develop the Cardano ecosystem but could burn the ADA if they wanted.
Then, by using the same set of growth rate assumptions for each chain (we calculated future CAGRs of 30%, 40% and 50%), we can start to make comparisons across chains and explore more deeply what drives YTP. For example, while APT has a high YTP, this is partially because the chain is relatively new and therefore its LQA revenues are smaller than other more established chains. SOL has modest inflationary schedules compared to a blockchain like NEAR or ICP. In all examples, a blockchain’s ability to burn tokens (and provide some kind of offset to new emissions) is helpful for managing YTP.
In conclusion, YTP serves as a crucial metric in evaluating the profitability and sustainability of L1 blockchains. By carefully designing tokenomics (inflationary or max supply), balancing supply dynamics, and incorporating burn mechanics, L1 blockchains can aim to reduce YTP and build a more sustainable blockchain economy.
Endnote
- Token Terminal is a platform that aggregates financial data on blockchains and decentralized applications.
WHAT ARE THE RISKS?
All investments involve risks, including possible loss of principal. The value of investments can go down as well as up, and investors may not get back the full amount invested.
Stock prices fluctuate, sometimes rapidly and dramatically, due to factors affecting individual companies, particular industries or sectors, or general market conditions.
Investments in fast-growing industries like the technology sector (which historically has been volatile) could result in increased price fluctuation, especially over the short term, due to the rapid pace of product change and development and changes in government regulation of companies emphasizing scientific or technological advancement or regulatory approval for new drugs and medical instruments.
Blockchain technology is a new and relatively untested technology and may never be implemented to a scale that provides identifiable benefits.
The opinions are intended solely to provide insight into how securities are analyzed. The information provided is not a recommendation or individual investment advice for any particular security, strategy, or investment product and is not an indication of the trading intent of any Franklin Templeton managed portfolio. This is not a complete analysis of every material fact regarding any industry, security or investment and should not be viewed as an investment recommendation. This is intended to provide insight into the portfolio selection and research process. Factual statements are taken from sources considered reliable but have not been independently verified for completeness or accuracy. These opinions may not be relied upon as investment advice or as an offer for any particular security.
Any companies and/or case studies referenced herein are used solely for illustrative purposes; any investment may or may not be currently held by any portfolio advised by Franklin Templeton.
The information provided is not a recommendation or individual investment advice for any particular security, strategy, or investment product and is not an indication of the trading intent of any Franklin Templeton managed portfolio.
Past performance does not guarantee future results.